

Every product carries
its own risk.
Loss gets reported by category, by store, by quarter. It is caused by a product. Seal scores every SKU you sell, on its own evidence, and moves that score the moment the evidence moves.
Nobody else resolves loss
to the product.
Every other tool stops at a category, a channel or a store. That is where the trail goes cold, because a category cannot be fixed and a store cannot be recalled. Seal carries the number all the way down to the SKU, and back up again.
Five states, and what
each one costs you.
A score on its own is a number. Every state carries an action, a price and a named owner, so nobody has to decide what a 63 means.
Not a sample.
The whole catalog.
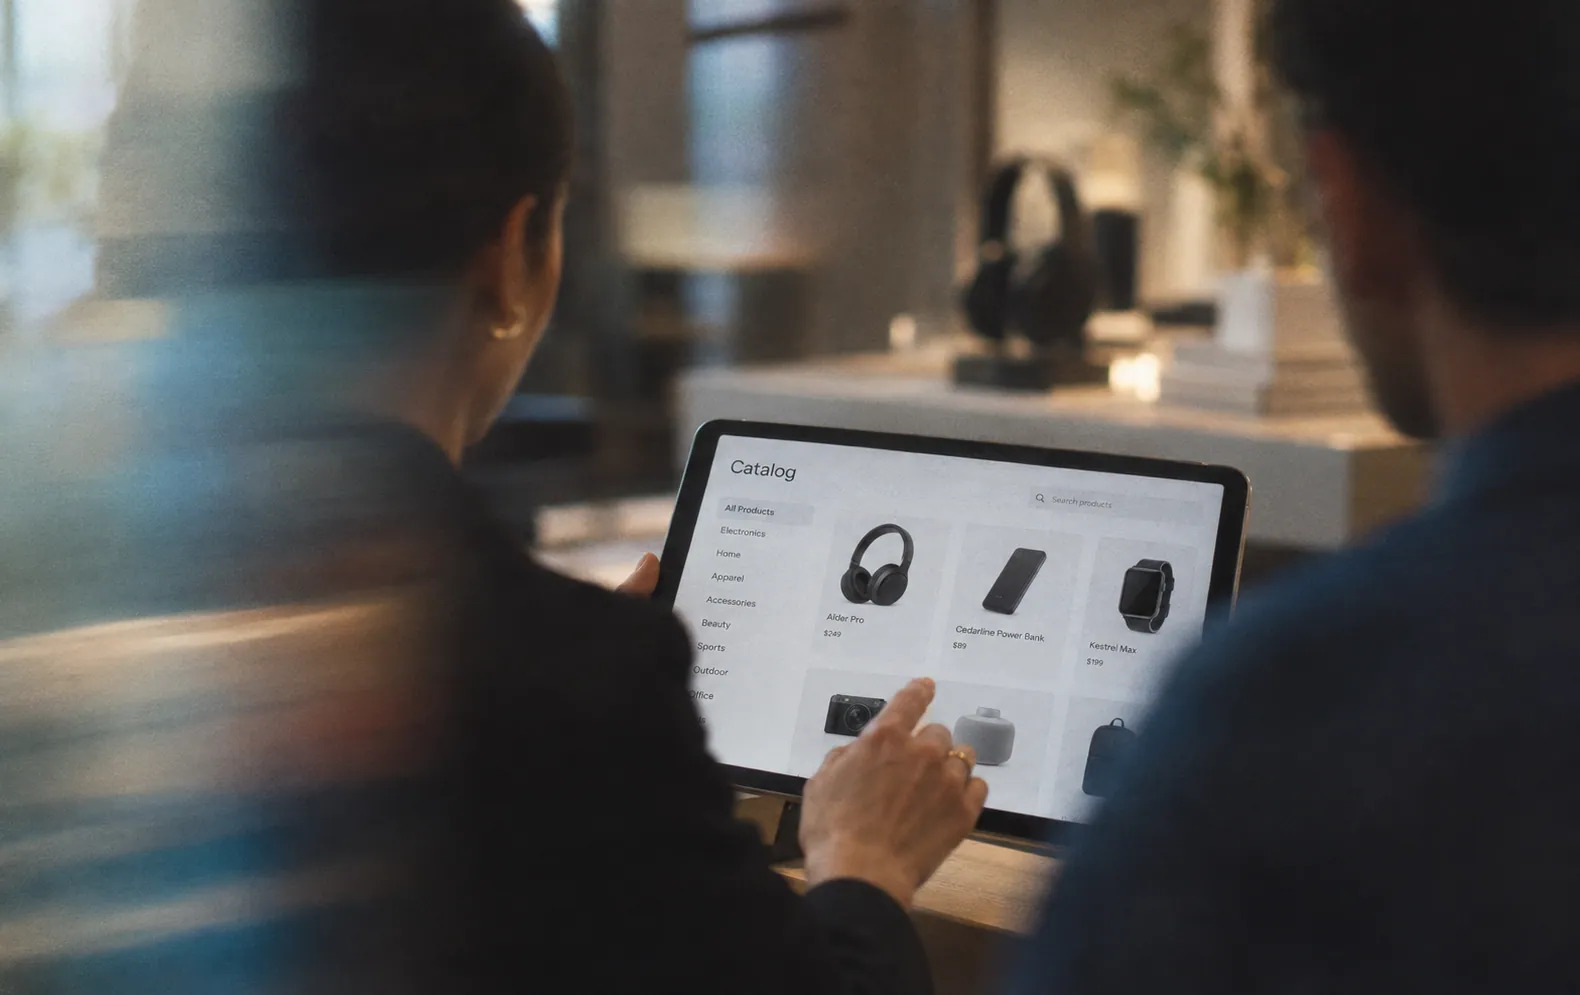
Every product carries a live score, refreshed on the evidence that arrives each day. Sort by it, filter on it, and open any one of them to read exactly what moved it.
Ask us what your
worst SKU is.
Send us a catalog. We will score it and show you the ten products carrying the most risk, with the evidence behind each one. No integration needed to find out.